24 Quick action buttons
Ryabhatta
The quick action buttons top of the dimenstionality reduction plot are loaded as soon as a dimensionality reduction plot is generated. These buttons allow quick view of QC metrics, switching between tSNE and UMAP dimensionality reductions, exploring meta data categories using either overlay or split by options and downloading the dimensionality reduction plot on the top.
24.1 Switch between tSNE and UMAP
The default reduction for Seurat objects is set to be UMAP in Ryabhatta.So that is loaded when the Seurat object is selected. Users can switch to tSNE reduction by clicking the Switch to tSNE button.
When the tSNE reduction is active, all of the downstream views (feature plots or UMI/number of genes per cell plots) are shown in tSNE reduction.
You can switch back to UMAP reduction using the Switch to UMAP, which appears instead of the Switch to tSNE button.
Switch to tSNE if present
In case, tSNE reductions were not performed, Ryabhatta provides the option to perform the tSNE reduction. Users can select the number of dimensions to use, and perform the dimensionality reduction. Then click on the Switch to tSNE to change to tSNE reduction.
Perform tSNE when not available
24.2 Display number of UMIs per cell
Users can view the number of UMIs or unique reads mapped to each cell using the Show UMIs per cell. This will generate a color coded dimensionality reduction plot showing the total number of UMIs registered across all the genes in each individual cells.
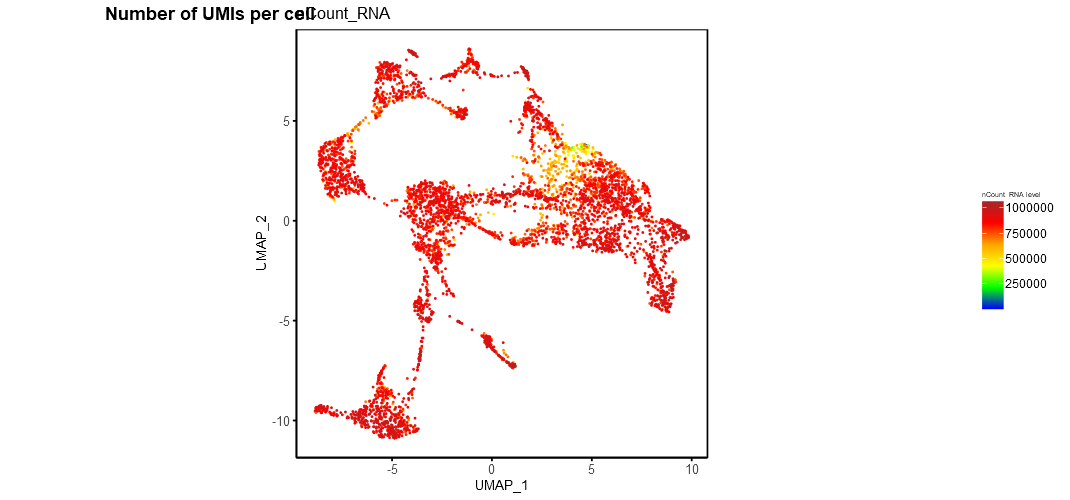
example UMIs per cell
24.3 Display number of genes per cell
Users can view the number of genes detected (number of genes with at least 1 sequencing read mapped within the cell) using the Show genes per cell. This will generate a color coded dimensionality reduction plot showing the total number of genes in each individual cells.

example genes per cell
24.4 Overlay meta information
Meta data information such as sample source, developmental stage etc., can be visualized using Overlay meta information. This helps to explore the distribution of different samples across clusters and identification of clusters or cells separated in dimensionality reduction space. Users can select the meta data category (other than Don’t split) and use the Overlay meta button.
Overlay or Split based on meta data
24.5 Split based on meta information
As with the overlay of meta data, it is possible to view the clusters under separate meta data categories using the Split on meta button.
Split view colors clusters per the identity set for each cluster.
As described in overlay meta data section, meta data with a maximum of 30 categories can be used in the split view. However, numeric values (such as pseudotime scores) cannot be used to split the dimensionality reduction plots.
24.6 Assign meta information as identity
The Identity is the current name for the clusters in a Seurat object. It can be the cluster number or cell type or meta data information such as sample name. This information can be changed in Ryabhatta using the Assign meta as identity button. To set a meta data category as the identity, select the meta data information from the meta data drop down menu, press the button. This will not remove the previous identity, as they are stored as IdentVersions
24.7 Assign Identity as meta information
There are instances where the meta data information (such as the treatment of the cells) will need to be set as identity. In these cases, users can select the meta data from the select meta data list and set that as identity using the Assign meta to identity.
For example to compare the changes in the treatment against another meta data information such as developmental stage, users can set Treatment as identity and then split the dimensionality reduction plot on developmental stage to explore the distribution of clusters between these two meta data classes.
Setting the identity to a meta data information class does not remove the previous version of meta data. This meta data could be restored using the IdentVersion list at the bottom of the left panel.
24.8 Download the plot
The dimensionality reduction plots (whether split or overlayed with metadata information or genes/UMIs per cell information) can be downloaded as a PDF file using the Download the plot.
24.9 Reset Dim plot
Dimensionality reduction plot can be reset to its original form using the Reset Dim plot. In this form, the dimensionality reduction plot shows the identity information set for the Seurat object and color coded according to this information.
Reset Dim plot returns the dimensionality reduction to the last set identity and tSNE or UMAP plot chosen. It does not remove any identities or meta data.
Currently, a cap of 30 unique values is set for the display of meta data. Meta data with more than 30 unique values will not be displayed. This maximum value is set to prevent the program from going into overdrive. For example plotting barcodes of individual cells as metadata will result in in thousands of different classes to plot. This could either crash or slow down Ryabhatta a lot.
Numeric meta data information such as predicted.celltype.score or pseudotime value can be overlayed on top of the dimensionality reduction plot. This will be color coded similar to the number of UMIs or genes plots shown above.
To overcome this limit, use set meta data as identity to visualize 30 or more values. caution setting numeric values as identities could crash or slow down Ryabhatta.