37 Cell cyle scores
Ryabhatta
Cell cycle markers or genes whose expression correlates with specific phases of the cell cycle have been identified and documented (Kowalczyk et al. 2015; Whitfield et al. 2002). These genes are part of the Seurat R pacakge and can be used to predict the cell cycle status of cells.Refer to Seurat Vignette for details.
Human genes used
| Category | Genes |
|---|---|
| S genes | UHRF1, MCM5, UNG, MCM6, BRIP1, TIPIN, UBR7, POLA1, RRM1, CLSPN, BLM, CHAF1B, MSH2, DTL, EXO1, NASP, CDC45, E2F8, HELLS, WDR76, RRM2, MCM2, USP1, TYMS, CASP8AP2, PCNA, GINS2, RPA2, RFC2, CDC6, GMNN, RAD51, CDCA7, ATAD2, PRIM1, SLBP, POLD3, DSCC1, FEN1, CCNE2, MCM4, RAD51AP1 |
| G2/M genes | CKAP5, CDK1, CDC25C, SMC4, NDC80, TACC3, MKI67, GAS2L3, HMGB2, HMMR, NUSAP1, CKAP2L, UBE2C, ANLN, CKS1B, BIRC5, NEK2, GTSE1, CKS2, CDC20, PSRC1, KIF2C, RANGAP1, AURKA, KIF11, G2E3, BUB1, CTCF, DLGAP5, LBR, CENPE, CKAP2, CENPA, TMPO, TOP2A, HJURP, KIF20B, CBX5, NCAPD2, TUBB4B, TTK, KIF23, CDCA3, CDCA2, ECT2, TPX2, AURKB, CENPF, CDCA8, CCNB2, ANP32E |
Mouse genes used
| Category | Genes |
|---|---|
| S genes | Chaf1b, Pold3, Prim1, Exo1, Mcm2, Gins2, Ccne2, Mcm4, Pola1, Msh2, Cdc6, Blm, Rad51ap1, Usp1, Rfc2, Dtl, Atad2, Brip1, Ung, Mcm6, E2f8, Rrm1, Tipin, Gmnn, Pcna, Ubr7, Casp8ap2, Ubr7, Cdc45, Tyms, Rpa2, Clspn, Fen1, Mcm5, Slbp, Wdr76, Hells, Uhrf1, Nasp, Cdca7, Dscc1, Rrm2, Rad51, Casp8ap2 |
| G2/M genes | Ckap5, Gas2l3, Cks1b, Kif2c, Ctcf, Tmpo, Tubb4b, Tpx2, Cdk1, Hmgb2, Birc5, Rangap1, Dlgap5, Top2a, Ttk, Aurkb, Cdc25c, Hmmr, Nek2, Aurka, Lbr, Hjurp, Kif23, Cenpf, Smc4, Nusap1, Gtse1, Kif11, Cenpe, Kif20b, Cdca3, Cdca8, Ndc80, Ckap2l, Cks2, G2e3, Ckap2, Cbx5, Cdca2, Ccnb2, Tacc3, Ube2c, Cdc20, Bub1, Cenpa, Ncapd2, Ect2, Anp32e, Mki67, Anln, Psrc1, Nuf2 |
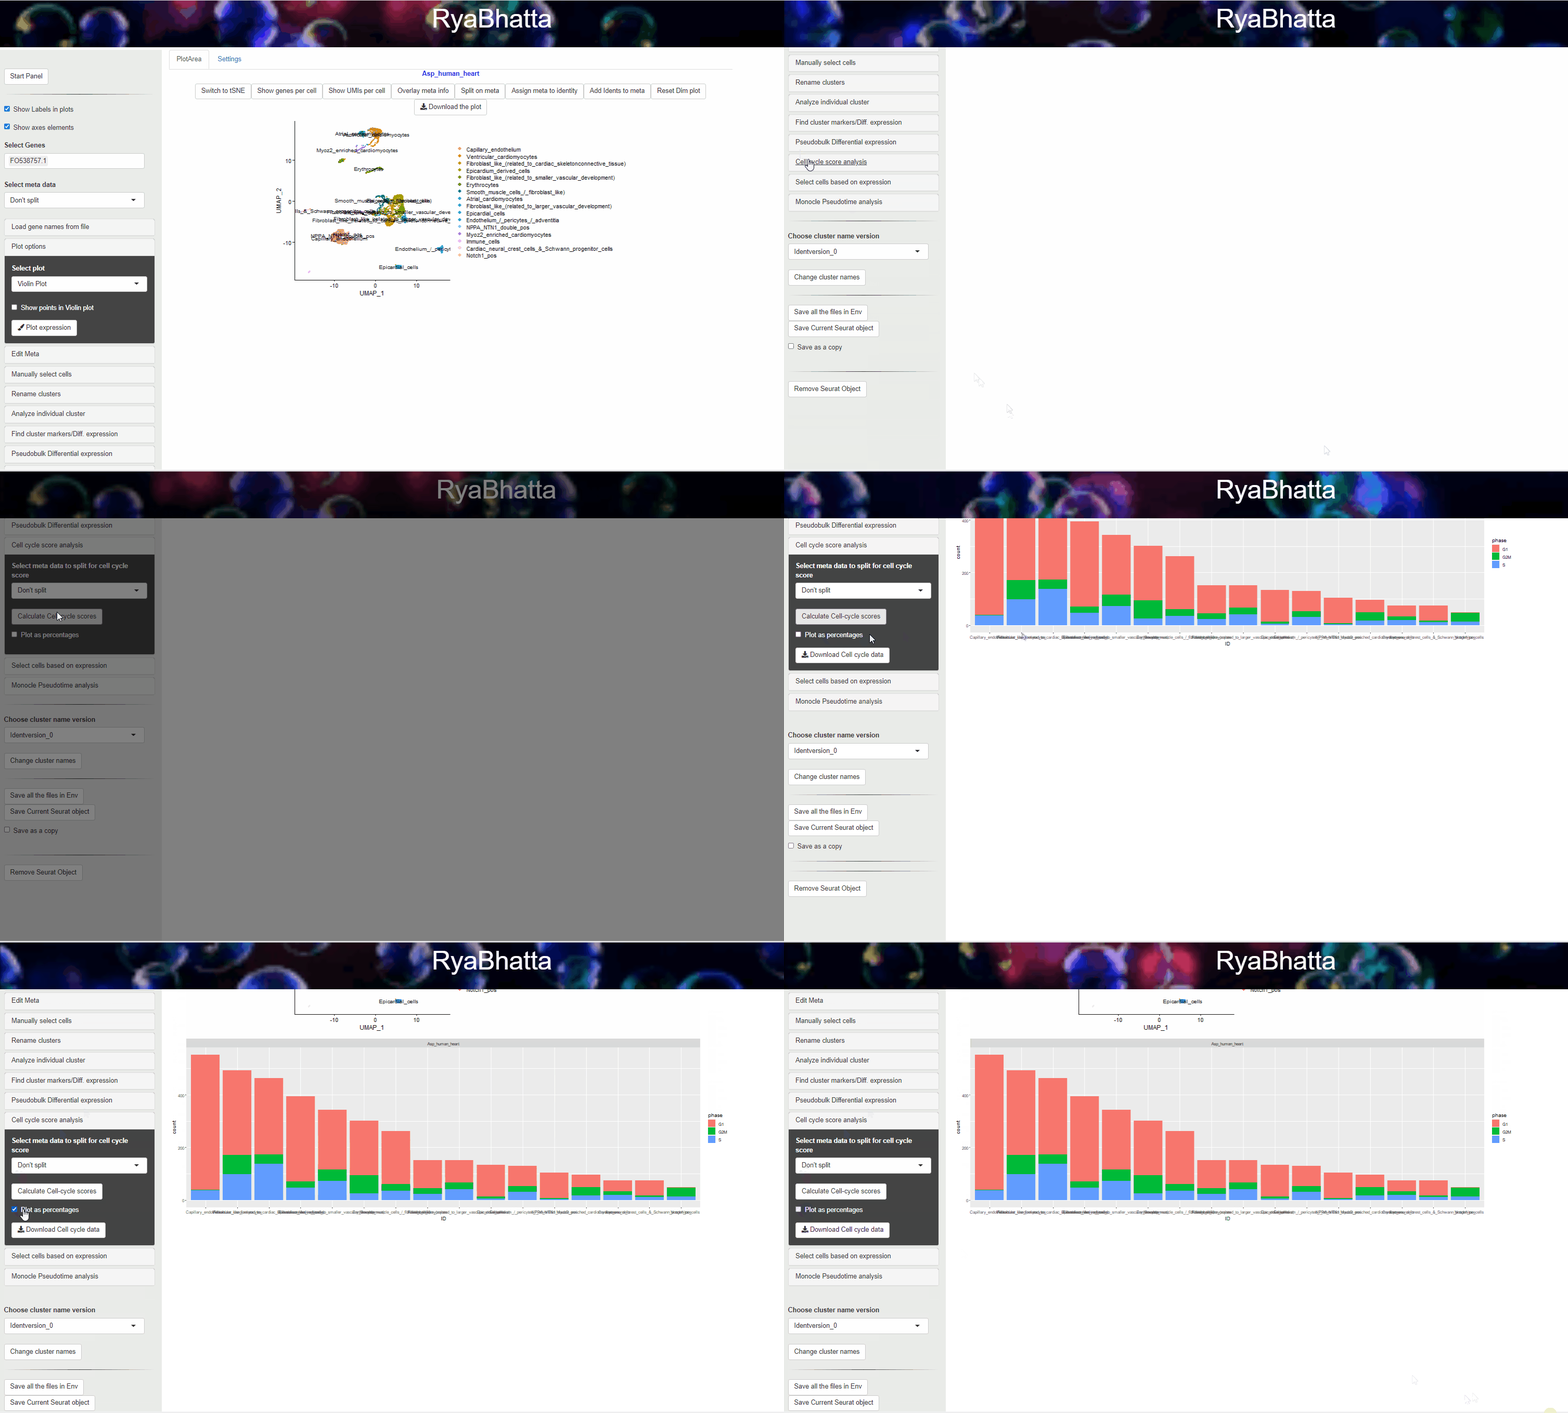
To perform this analysis select Cell cycle score analysis panel.
Then click Calculate cell-cycle score to show a graph with the number of cells in each category/cluster that are predicted to be in a specific cell cycle phase.
You may choose to show the percentage of cells in each category that are in the specific state by checking the Plot as percentage option.

Cell cycle scoring analysis
References
Kowalczyk, M. S., I. Tirosh, D. Heckl, T. N. Rao, A. Dixit, B. J. Haas, R. K. Schneider, A. J. Wagers, B. L. Ebert, and A. Regev. 2015. “Single-Cell RNA-Seq Reveals Changes in Cell Cycle and Differentiation Programs Upon Aging of Hematopoietic Stem Cells.” Journal Article. Genome Res 25 (12): 1860–72. https://doi.org/10.1101/gr.192237.115.
Whitfield, M. L., G. Sherlock, A. J. Saldanha, J. I. Murray, C. A. Ball, K. E. Alexander, J. C. Matese, et al. 2002. “Identification of Genes Periodically Expressed in the Human Cell Cycle and Their Expression in Tumors.” Journal Article. Mol Biol Cell 13 (6): 1977–2000. https://doi.org/10.1091/mbc.02-02-0030.
The plot can be split into separate meta data categories using the meta data drop down menu. Select the meta data category and click Calculate cell-cycle score again.