13 Finding markers for clusters
13.1 Markers
Once clustering is performed, it is possible to identify genes that display a strong bias in their expression towards a specific cluster. In otherwords, these genes serve as characteristic markers of the clusters. In Natian this can be achieved by selecting parameters for finding markers genes.
Typically, cluster markers are identified by performing a differential expression analysis between a specific cluster against all other cells in the dataset. This helps identify genes with a strong bias in their expression towards a particular cluster.
13.2 Threshold for change
In Natian, users can select the threshold to find marker genes that display a given log2 fold change or higher when compared between a specific cluster against all other cells in the data set. A higher threshold can help identify specific markers for a cluster. However, too high a threshold can lead to the identification of no marker genes at all.
Note: It might be useful to set a low threshold initially to identify a large number of markers. Then progressively increase the threshold to identify more specific markers.
13.3 minimum percentage expression
In Natian, users can select the minimum expression cut-off for genes to be considered for marker selection. Using this would remove cells that are sparsely expressed in a cluster but not expressed elsewhere, therefore giving a false positive. It can also be used to select genes that are broadly expressed within a cluster and not in a specific subset of the cluster.
Note: Single-cell datasets suffer from technical drop-outs as well as noise due to cellular transcriptional dynamics. Therefore gene expression are noisy and too-high a threshold in minimum expression cutoff might yield no genes.
13.4 Number of markers to display
The number of markers that needs to be used to make the heatmap can be selected. The default is 5 markers per cluster.
13.5 Find only positive markers
As the marker identification process is essentially a differential expression analysis, it is possible to identify genes with a strong bias towards a cluster as well as genes that are absent or expressed at relatively low levels with in a cluster. For identification of a cluster’s cell type or state, negative markers are often not helpful. For identification of only positive markers, select the check box under the threshold settings before pressing the Proceed to Marker Identification
13.6 Markers table and Switch to marker’s view
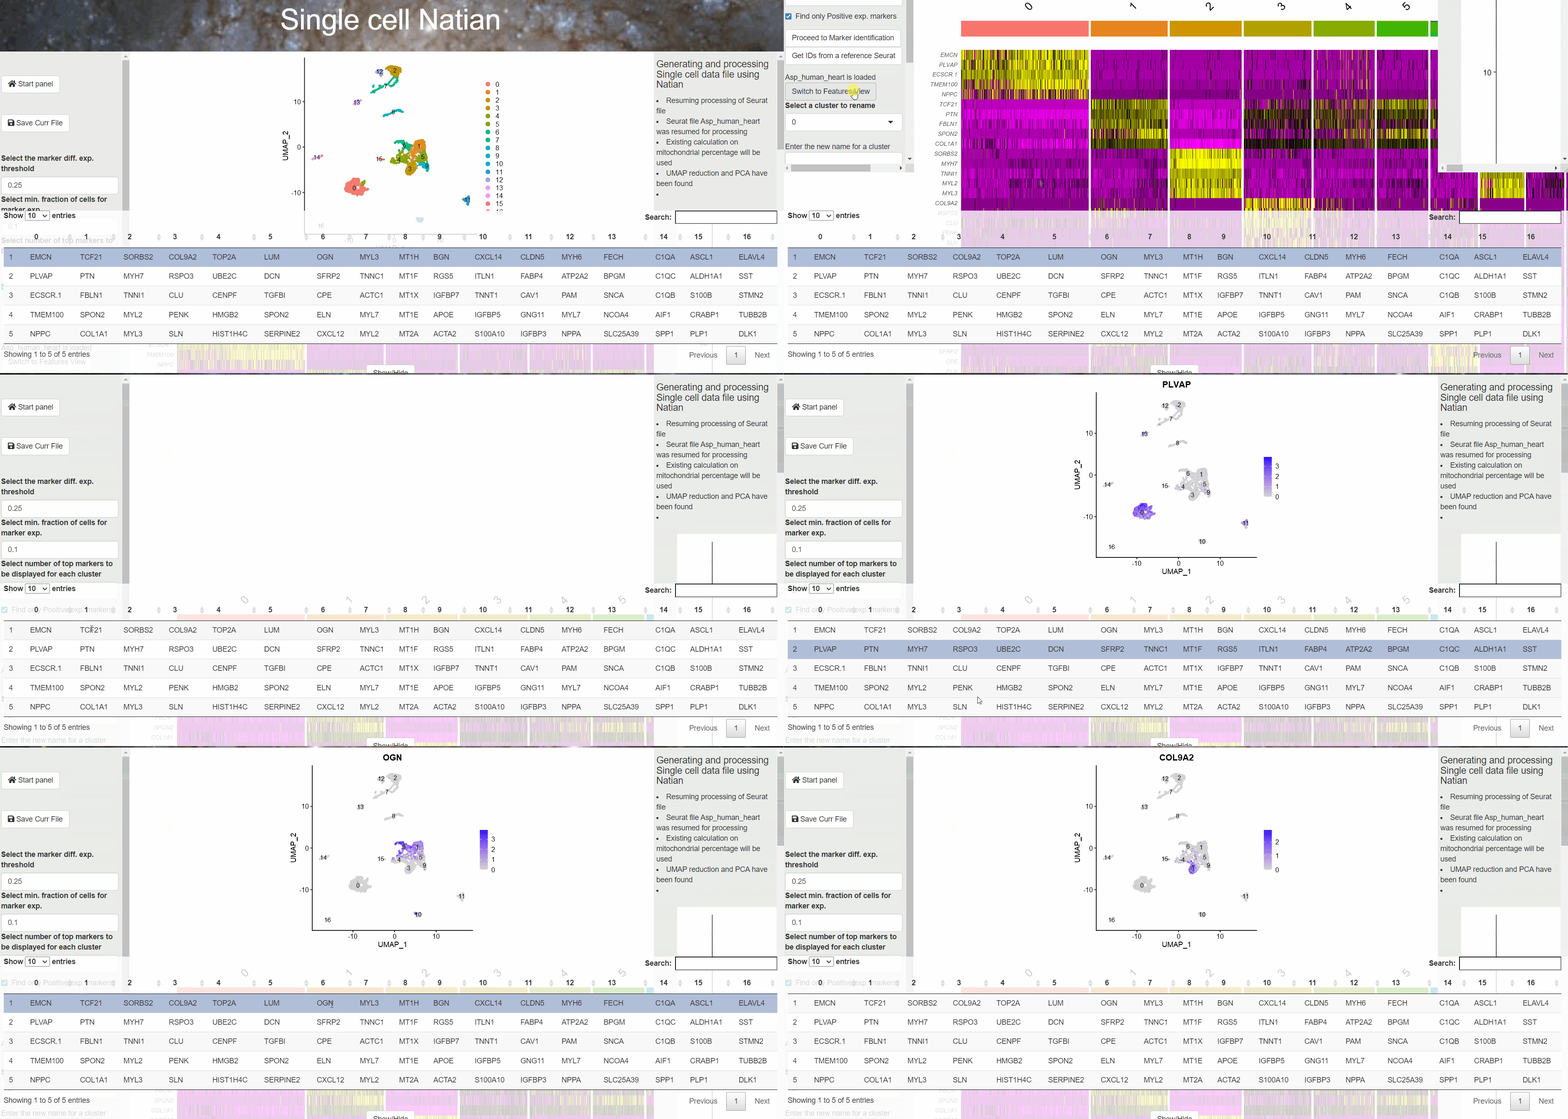
The result of a the find markers step above is a heatmap where the expression of individual cells is shown as a z-transformed, normalized expression of the genes.

Heatmap showing Z-score transformed expression of markers in each cluster
A table with the markers identified for each cluster is displayed at the bottom. At this point, users can click on the Switch to markers view to change the dimensionality reduction plot to markers view plot. Now, users can click on the gene name within the table at the bottom of the page to see the expression of the marker.
Note: The dim plot will dissapear when you clilck on the Switch to markers view . This is normal.

Switching to Features View to explore identified markers
Note: While a gene might appear to be a marker for a cluster when compared to all the other cells in a dataset, there may be another cluster where the gene shows similar expression pattern. Typically, this indicates a relationship between two clusters. The relationship could be as subtle as clusters undergoing cell division to indicating cell types at different stages of differentiation. These differences can be further explored by initially combining these clusters into a single group, but subsequently performing a subcluster analysis using Ryabhatta