35 Monocle Pseudotime analysis
Ryabhatta
Pseudotime analyses provides access to latent temporal information from single-cell data sets (Campbell and Yau 2018). Monocle is an R package to perform such analysis on single-cell data.
Note In Ryabhatta, we use monocle version 2. There are a couple of reasons for this choice 1) Monocle 2, unlike monocle 3 does not require a root point to be chosen in an explicit manner. 2) Monocle 2 is available through CRAN as a package to install, minimizing conflicting dependencies with other packages used in Ryabhatta 3) As described by the author, DDRTree algorithm is no longer supported in monocle3, which works well for data set under 100,000 cells and provides a new dimensionality reduction plot to display the minimum spanning tree. We find this display useful in simiplifying the trajectory analysis. https://github.com/cole-trapnell-lab/monocle3/issues/187#issuecomment-540229295
To perform pseudotime analysis using Ryabhatta, click on the Monocle pseudotime analysis panel.
If no pseudotime analysis data is present in the Seurat object then,
A Perform pseudotime analysis will be available for the user.
Click on the button to perform pseudotime analysis
This process will take a long time (2-24 hours depending on the size of the data)
It could also result in memory exaustion and the app crashing if the data is too big to perform this analysis.
It is recommended that immediately after processing the data using this button the Seurat object is saved using the save Seurat functions at the bottom left of the panel.
When Perform pseudotime analysis is chosen, the Seurat object is converted into a celldataset or cds object to perform monocle pseudotime analysis.
Here, an additional cutoff is applied on the genes. Genes with 50 or more cells of expression are considered for downstream analysis. Subsequently, a dispersion table is calculated and a mean_expression threshold of greater than or equal to 0.1 is applied to the dispersion table. The result graph and the dimensionality reduction information are stored in the Seurat object as well as a copy of the cds object.
These results are then used to explore the data.
Pseudotime information and the monocle state information calculated using this process is stored as a meta data in the Seurat object.
If pseudotime analysis has already been run on the Seurat object using Ryabhatta, then the following buttons and options are available for exploration of the data
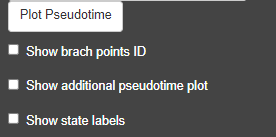
Monocle pseudotime options
Clicking on the Plot Pseudotime will result in plots showing the dimensionality reduction performed using monocle. This data can include gene expression if Select the genes box carries genes.
If no genes are selected the clusters identities are used to color the cells.
Monocle pseudotime analysis
We have observed that it is better to perform pseudotime analysis when an obvious parent-child relationship exists between the cells used in the analysis for example: data collected from two different (closely-timed) developmental stages or cells collected with different treatments undergoing differentiation or cell lineages with common precursors or intermediate states
This kind of relationship may not be applicable for all cell types in a data. Therefore, it is better to perform this analysis on a subset of cell/clusters where such an information is available.
For example: Rather than examining all the cells in a lung data which has cells of different origin such as epithelial cells, immune cells, and endothelial cells, it is better to perform the analysis on a subset of the cells (immune cells) to infer changes in their latent temporal states. When the analysis is performed on the whole data, the result might be primarily driven by the classification of the cells into their respective cell types.
As the cell type information cannot be identified/confirmed without marker gene evaluation, we have provided this option in Ryabhatta and not in Natian, even though this is a computationally intensive task.