12 Dimensionality reduction and clustering cells
In Natian both a UMAP and a tSNE reduction are done using the specified number of dimensions and the resolution parameter.
Once the dimensionality steps are completed, a dimensionality reduction plot showing the UMAP reduction. Like the one below. The clusters are given the identity based on the size of the cluster starting with 0 to indicate the largest cluster.
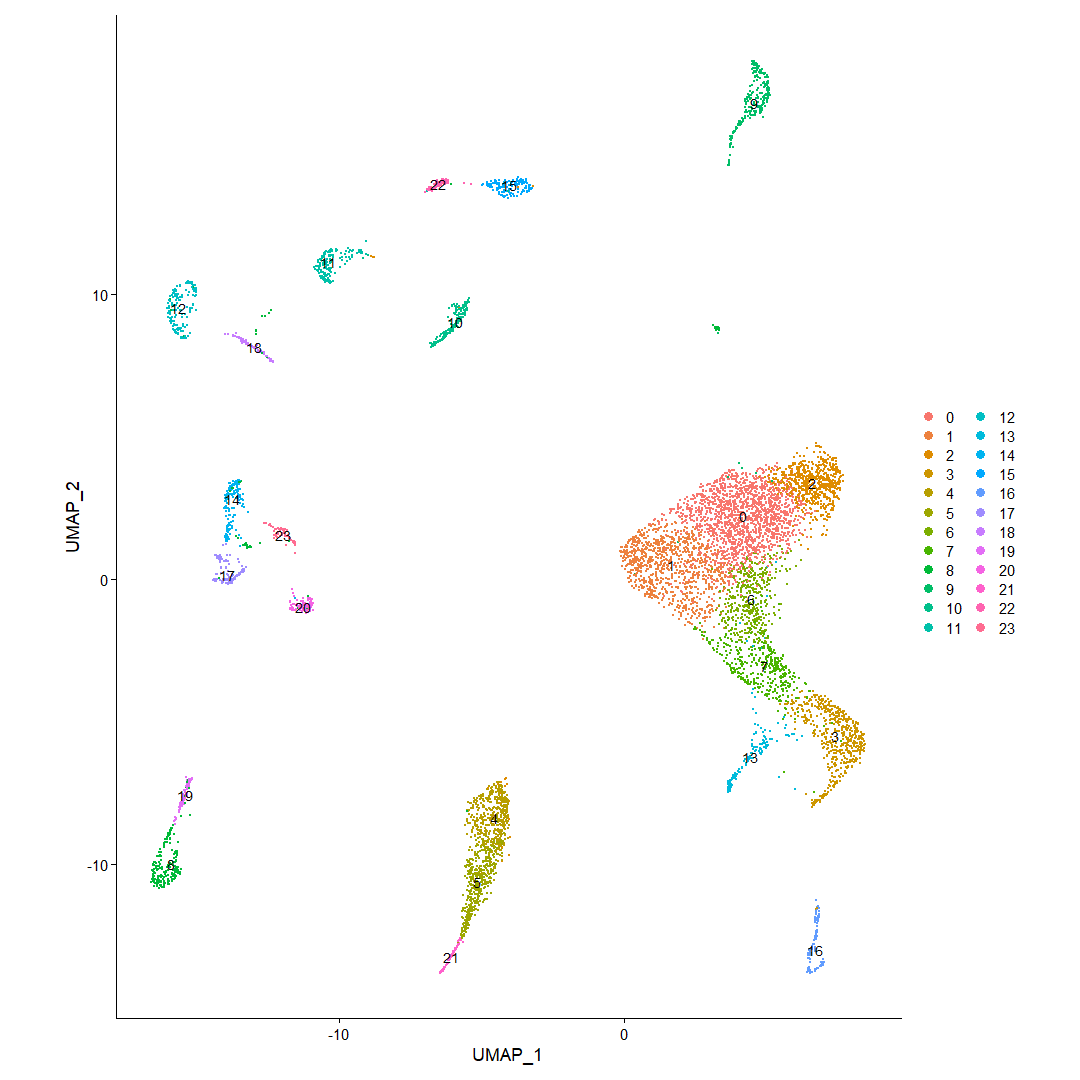
UMAP dimensionality reduction plot showing clusters identified using unsupervised clustering
Along with this plot the number of cells assigned to each cluster is calculated and presented as a barchart below the dimensionality reduction plot.
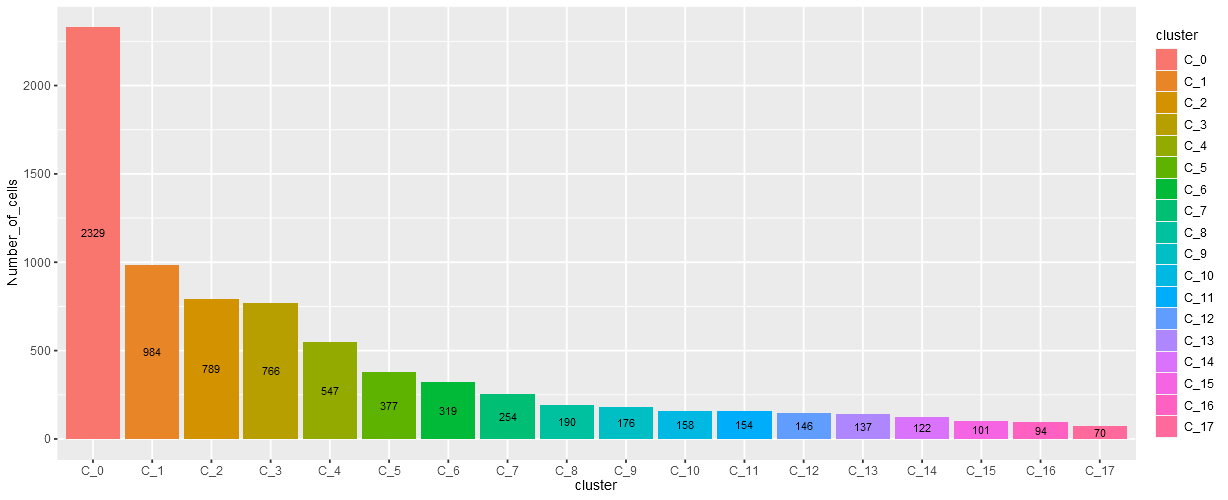
Barplot showing different number of cells in each cluster
12.1 Repeating dimensionality reduction
In Natian, you can repeat the dimensionality and clustering steps by clicking on the Repeat dimensionality reduction/clustering.
In this case, PCA analysis is repeated with highly variable genes and dimensionality reduction options described in the previous section where normalization, finding variable genes, scaling and principal component analysis steps are performed.
12.2 Upload dimensionality reduction
In certain instances, dimensionality reduction data might be provided with the data submission. In these cases, where a previously computed dimensionality reduction is available, UMAP or tNSE reductions need not be calculated again. Instead, the information can be downloaded as a .csv or .txt file and uploaded into Natian using Upload dimensionality reduction data. The uploaded dimensionality reduction will be used to create a dimensionality reduction data compatible with Seurat and uploaded into the Seurat object.
Note: When using a previously computed dimensionality reduction, Natian will filter cells to only those that have a dimensionality reduction. If choosing to use dimensionality reduction, filtering cells based on UMI/Gene count or percentage mitochondrial expression may not be needed.