5 Processing work flows
Natian
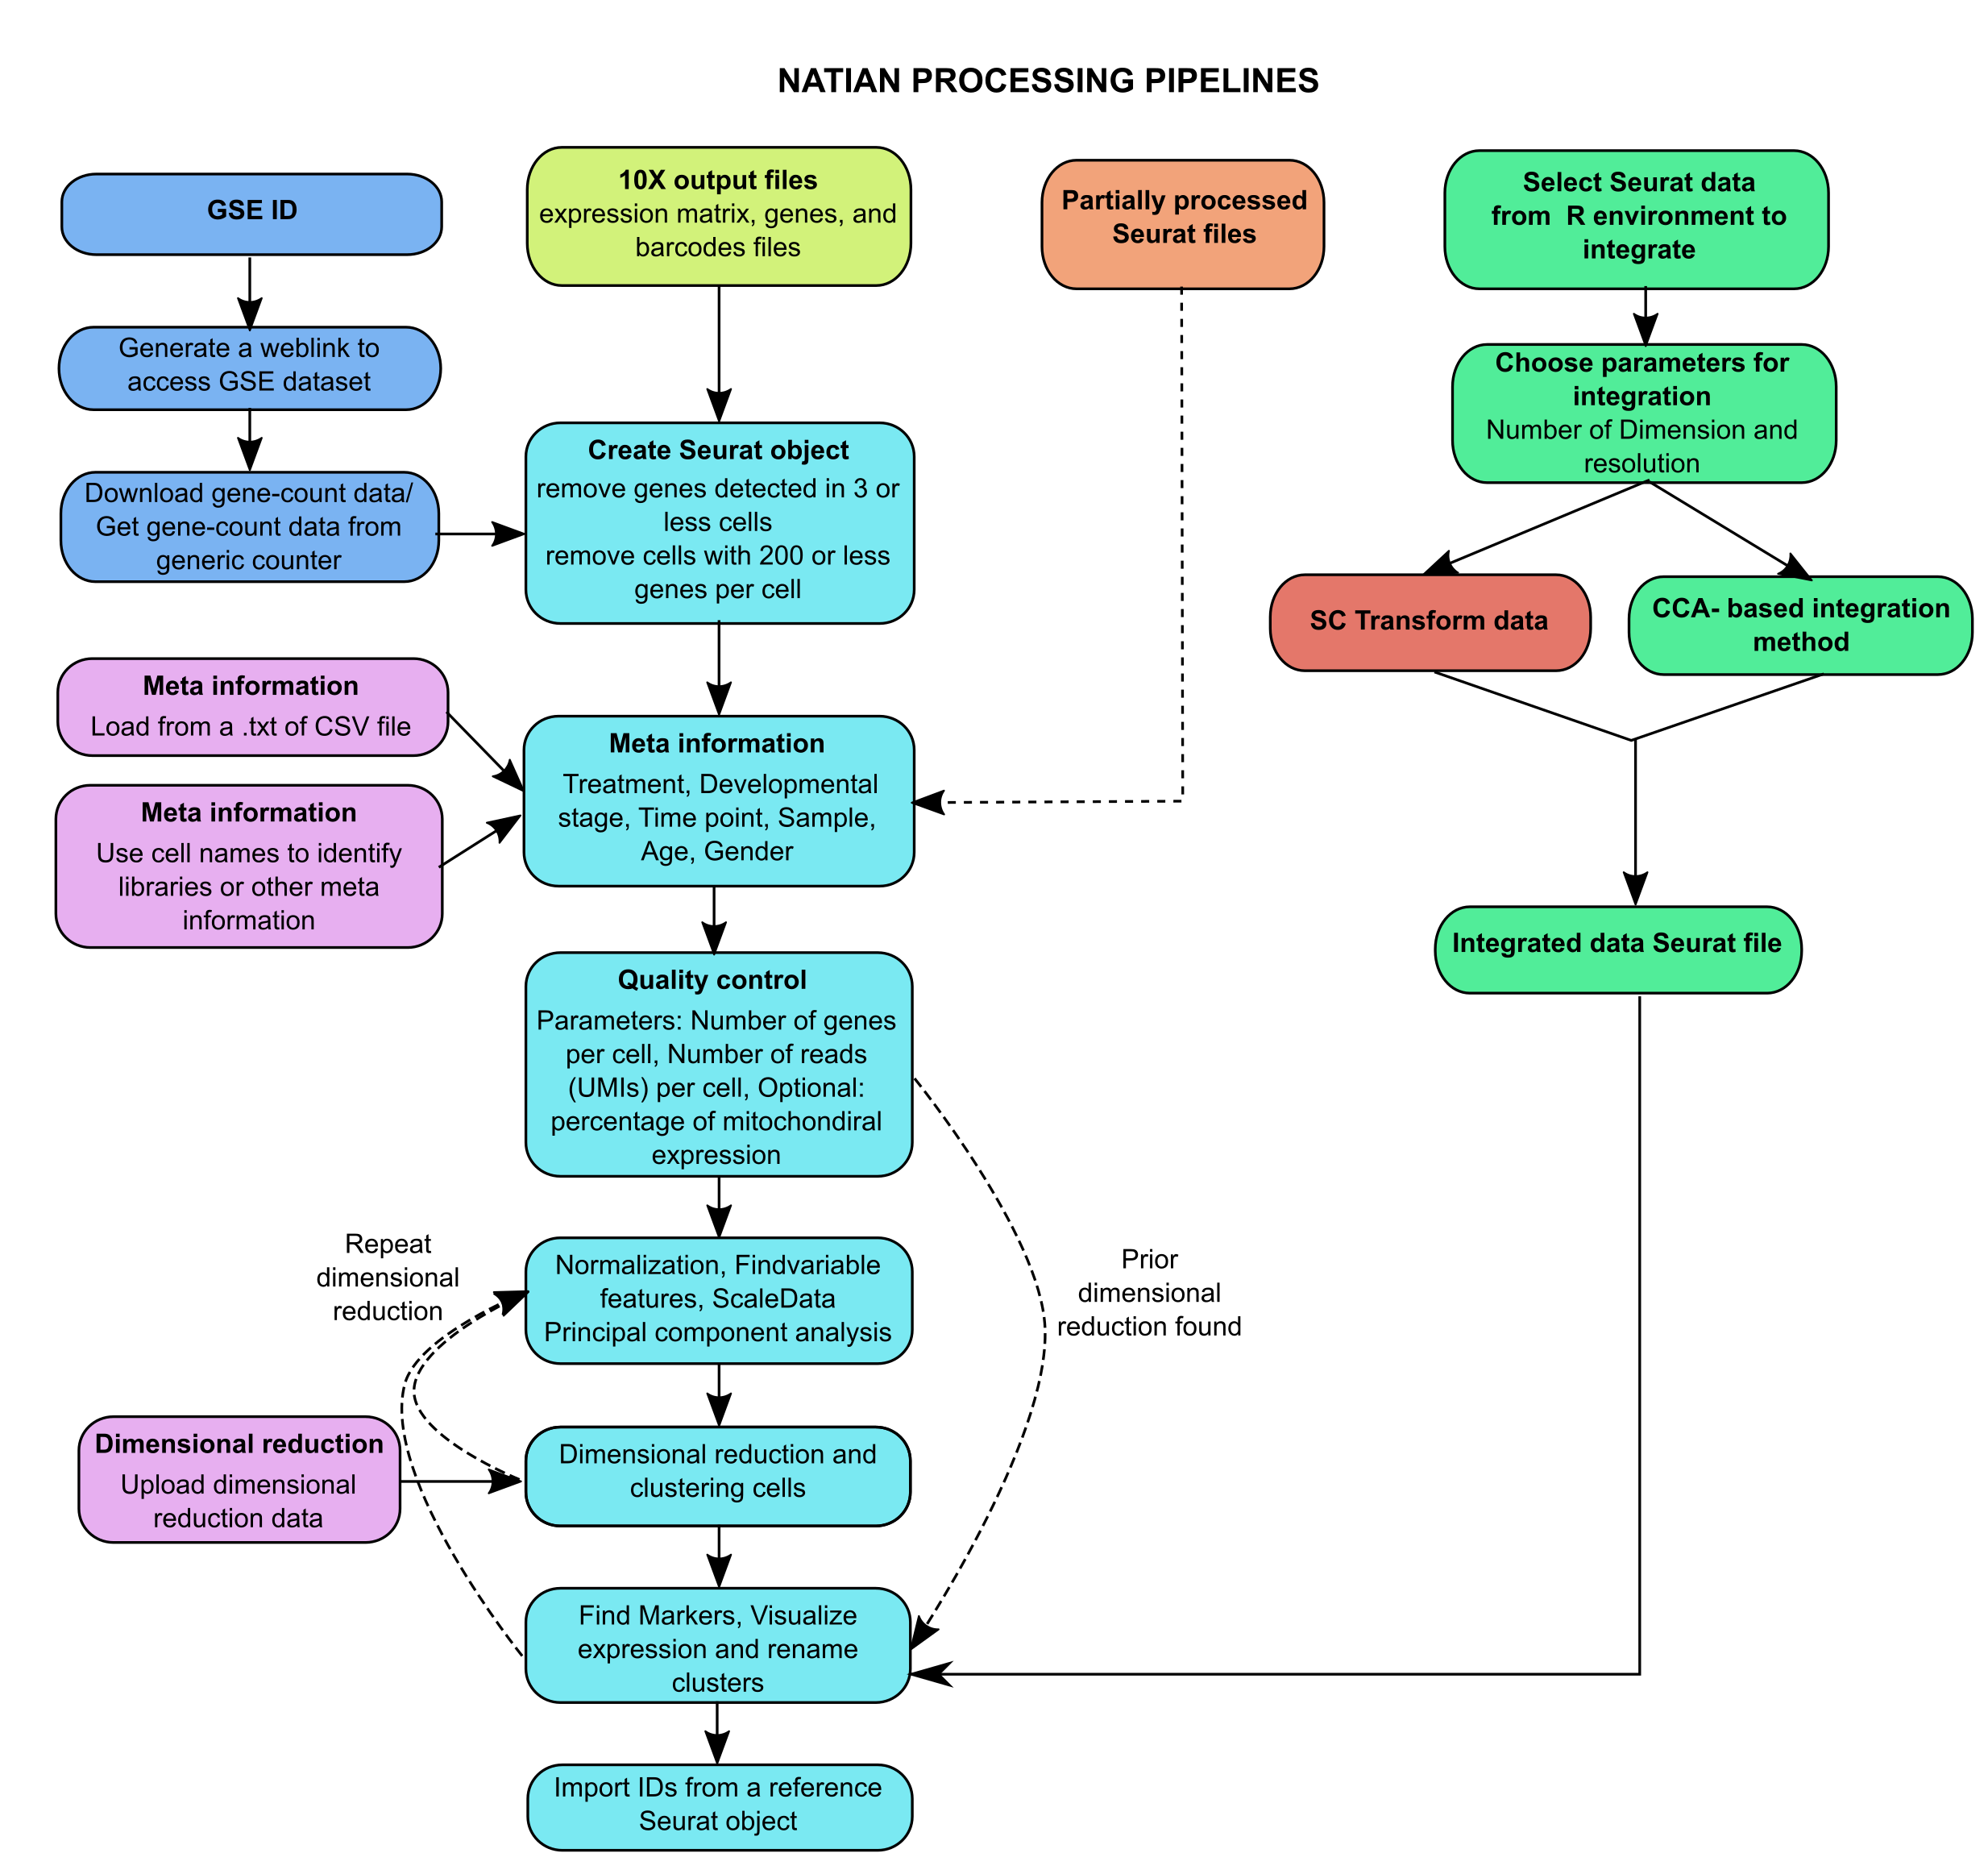
Natian_processing_workflows: Flow diagram showing the sequence of steps involved in creating a Seurat object from the single-cell output from 10x Genomics or other pipelines and integration of existing Seurat objects. Element/steps are color-coded to show common (cyan), GEO data analysis (blue), 10x output analysis (lime green), partially processed (orange), integration of Seurat object (green), optional (purple), and scTranformation step (red). Solid lines show the normal flow of steps, dotted lines show alternative routes.