25 Display settings
Ryabhatta
In Ryabhatta, there are options to change the color scheme of plots once rendered. Since the number of colors needed in a plot cannot be estimated a priori, the app allows users to set the colors post plotting.
In the current version it is not possible to set a color-scheme as a permanent option. In future versions, this will be tagged to the Seurat object which can then be used to plot the different plots.
25.1 Show labels on the plots
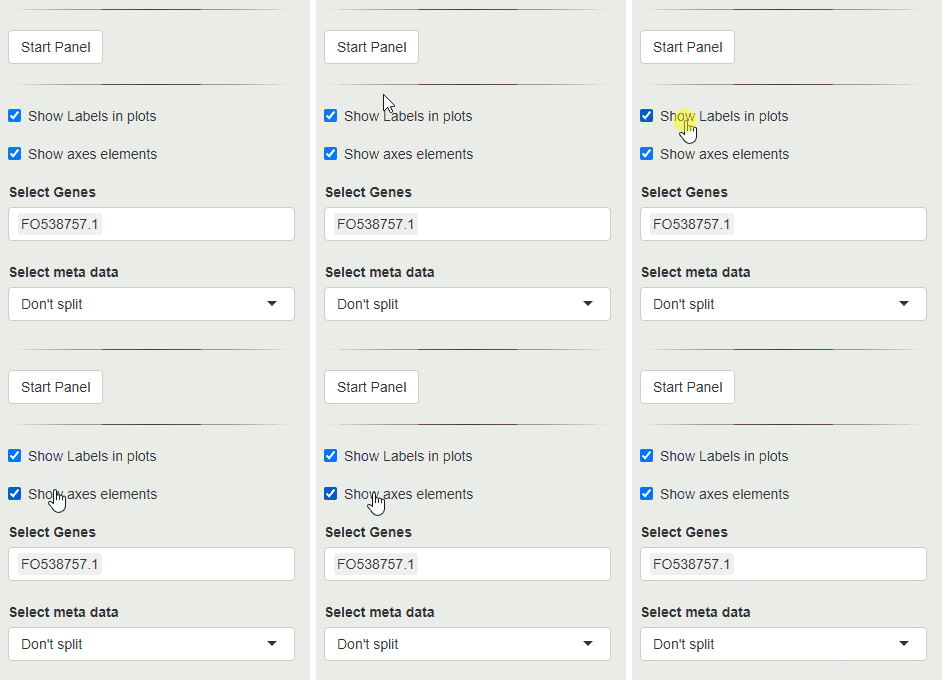
If there are too many labels, or if the labels are affecting visualization of a plot, they can be removed by un checking the Show Labels on plots option on the top-left corner of the screen.

Turn OFF/ON labels showed on plots
25.2 Show axes on the plots
Just as above, it is possible to turn off axes elements using the show axes elements option.
25.3 Change plot features like point size, point color
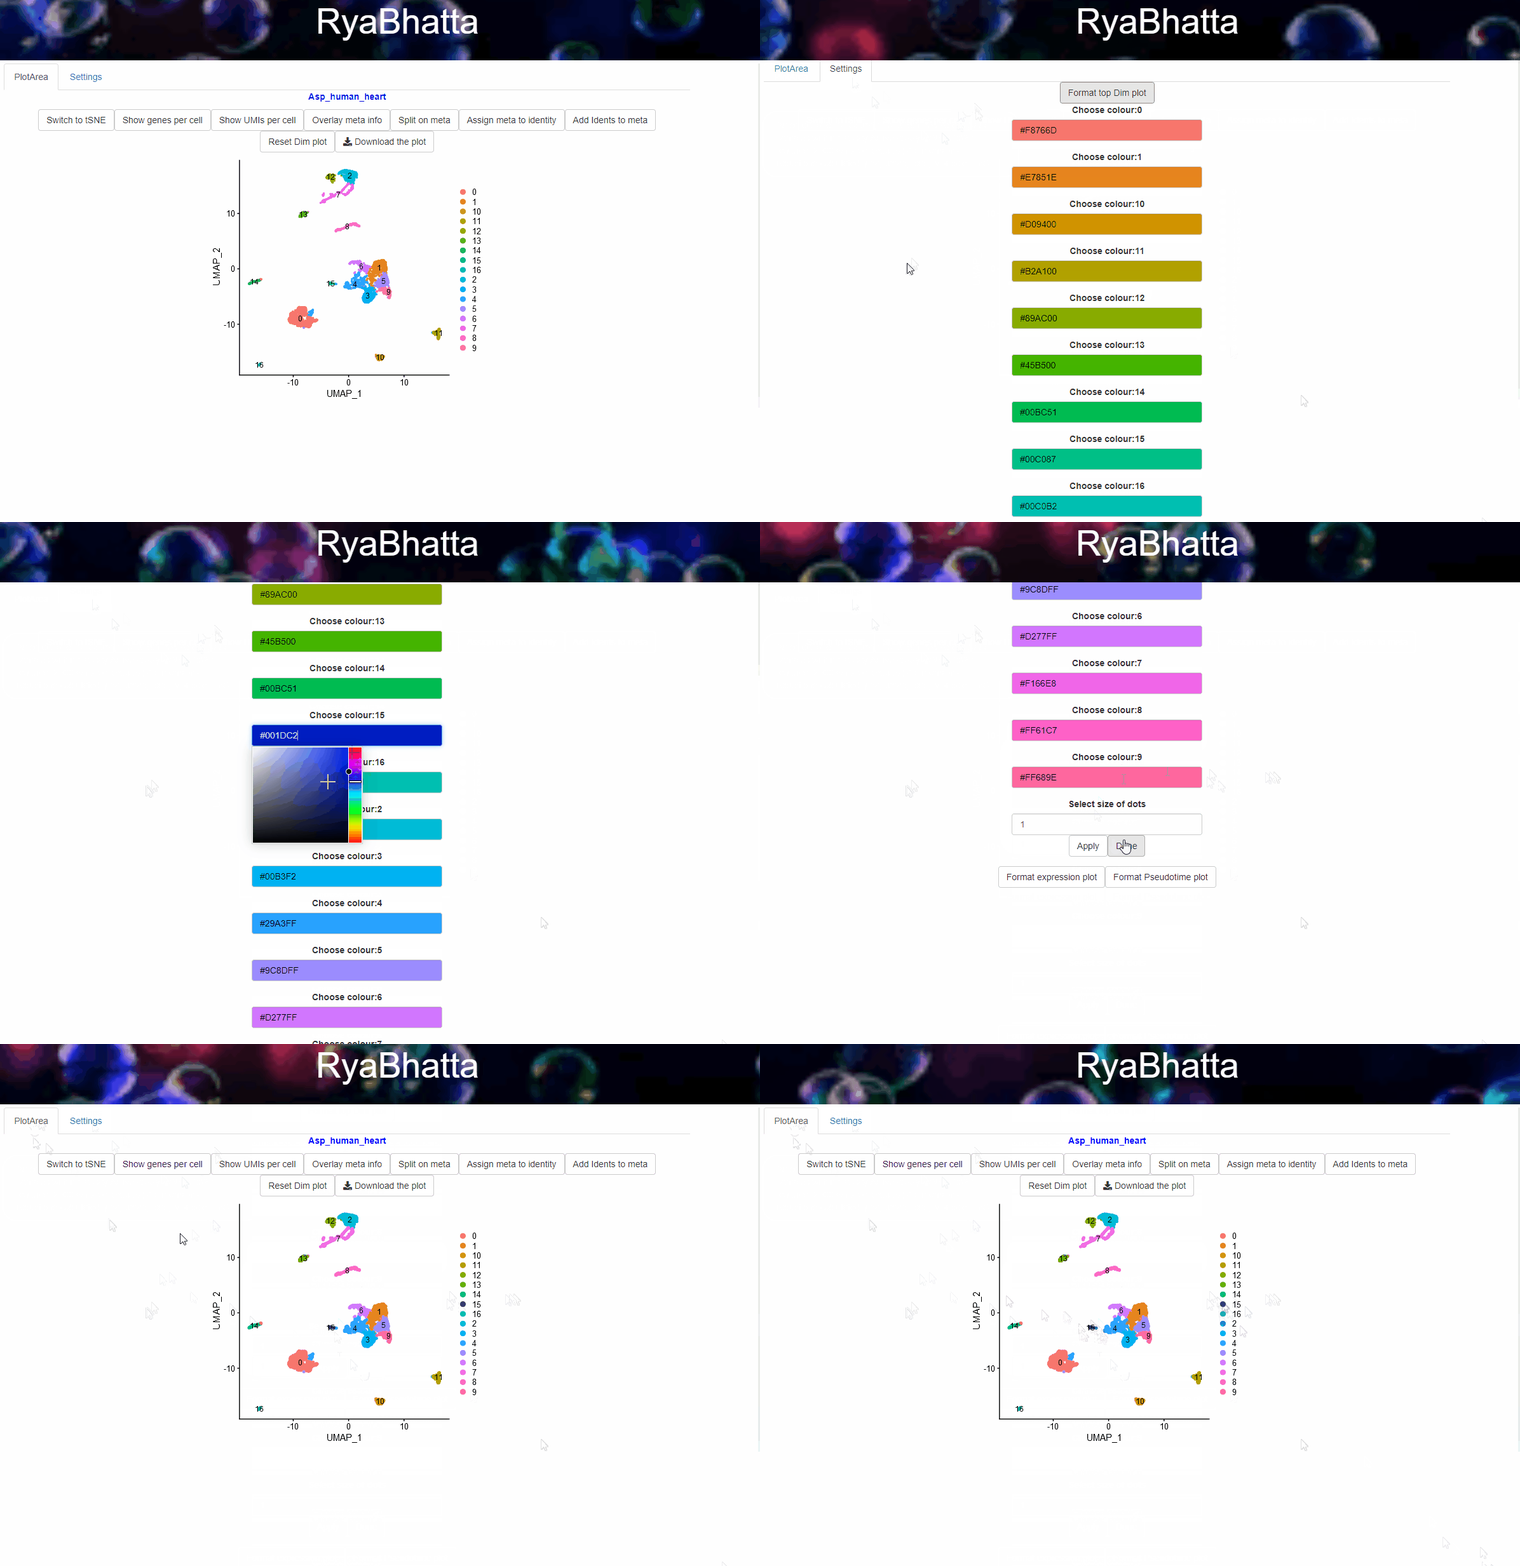
It is possible to change the size of the points shown in the dimensionality reduction plots using the format options under the settings tab.
25.4 format Dimensionality reduction graph
select the format top Dim plot to create a list of current colors used in the top dimensionality reduction plot. From here select color for the different clusters.

formatting dim plot colors
25.5 format the expression plots
After creating a violin or a feature plot, colors can be changed for individual clusters/samples. In this case, select format expression plot.
In the case of violin plots, this will list the colors of the different samples/identities/clusters in the violin plot.
In the case of the feature plots, this will list the low and high colors for the plots.
The cluster colors are shown in the order they appear in the identity list. If the clusters are labelled 0,1,2… then the colors are also shown in that order.
Since the color scheme is not saved in this version, it might be worth writing down the hexadecimal code (#223424) for each color. This color number can be typed in to the next round if a specific color scheme is chosen.