9 Quality control options
The next step when processing the Seurat object using the standard pipeline in Natian is to measure quality control metrics. The number of genes and the number of reads captured in each cell form the standard metrics to identify outliers. Outliers with high levels of either of these two parameters are likely doublet cells and need to be removed. Cells with low levels of either of the parameters likely suffered from poor capture or sequencing artifacts. In some cases, the use of the percentage of mitochondrial transcripts registered compared to all the reads within a cell also assists in the identification of cells with a higher level of background or partial capture of nuclear transcripts. Natian provides options to iteratively check the limits of each of these parameters to determine the optimal thresholds with feedback on the number of cells filtered through the process.

QC sliders use example
Selecting Perform initial QC analysis will generate three violin plots and allows the users to filter outliers based on two/three QC metrics.
- Genes per cell
- Number of UMIs/counts per cell
The number of UMIs expressed per cell can vary due to a lot of factors including the difference in transcription status of different cells as well as technical issues such as poor capture and sequencing. A large deviation from the rest of cells is usually suggestive of doublets and can be removed by setting an upper limit for the number of counts or UMIs per cell
- Percent mitochondrial expression
For human and mice genes the naming convention for the mitochondrial genes is “MT-” and “mt-” prefix in front of the gene names. This is used to calculate percentage mitochondrial expression. If the data is from a species where either of these two conventions is not used, percentage mitochondrail expression might not be calculated.
A useful guide to selecting percentage mitochondrial cutoff in different samples Osorio and Cai
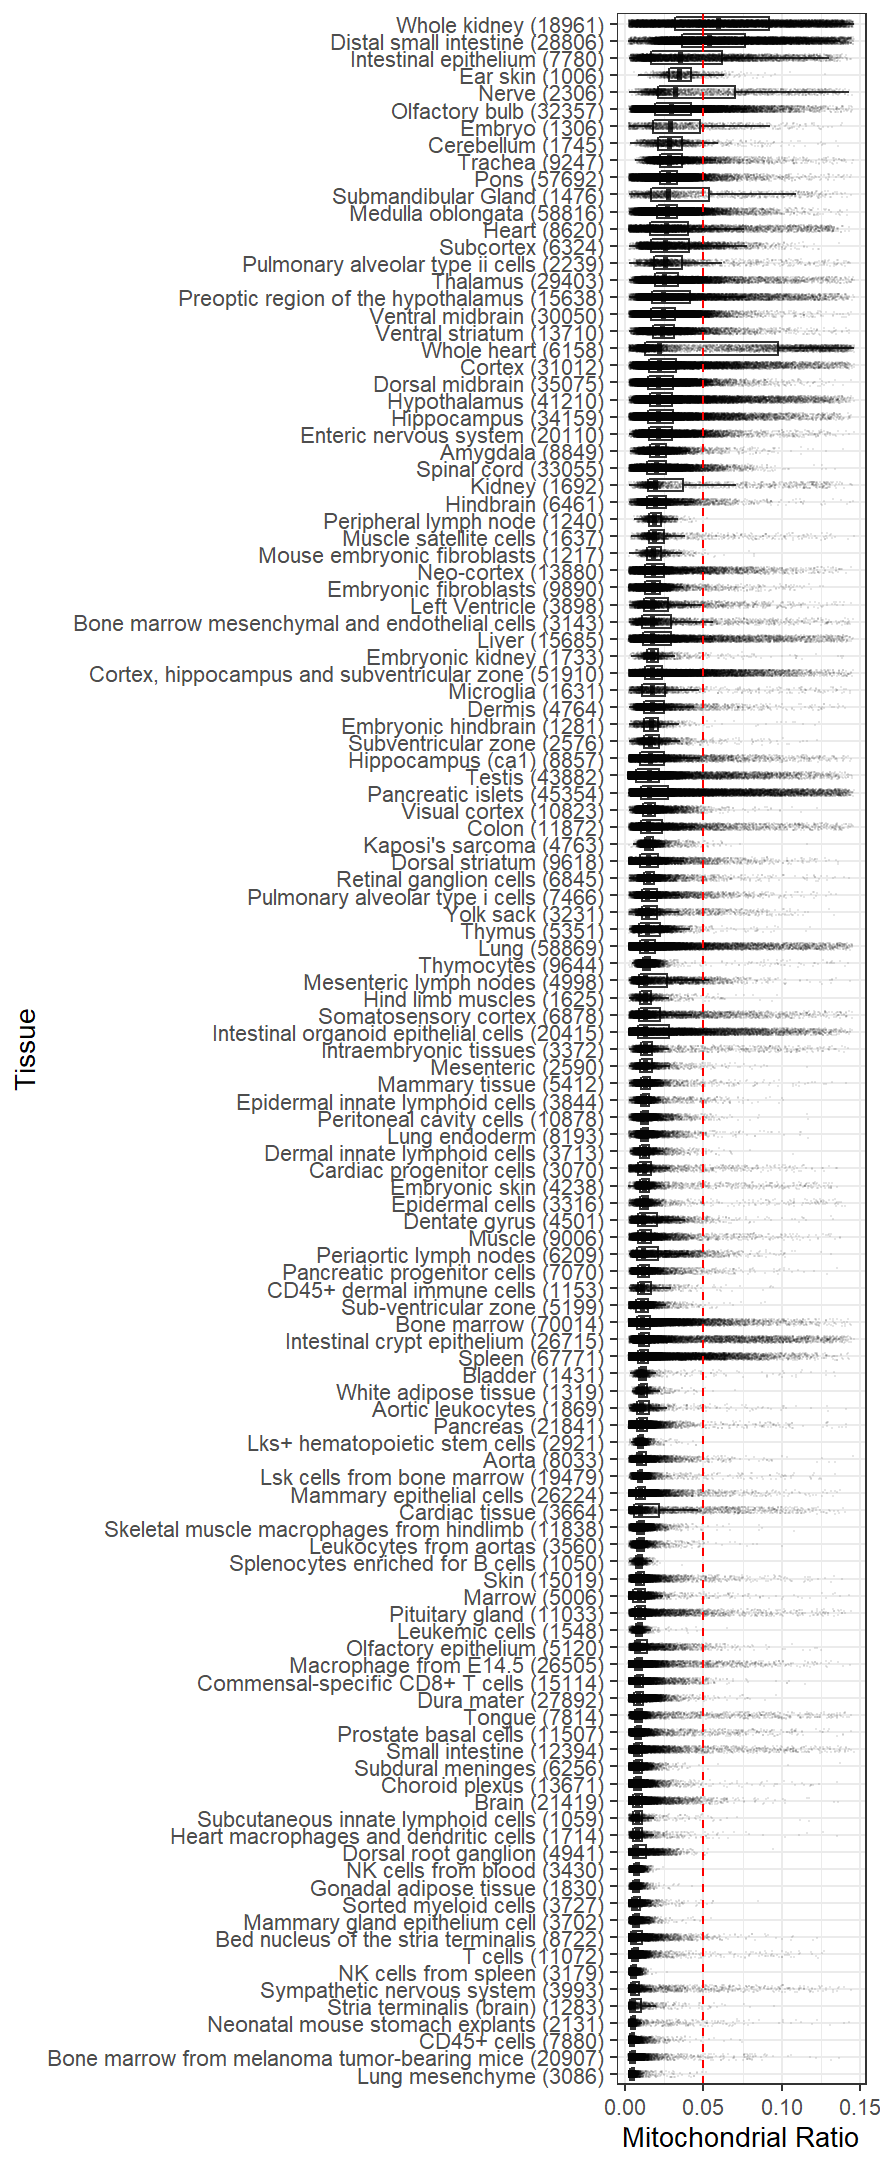
Mitochondrial content from different tissues (source: https://github.com/dosorio/mtProportion/)
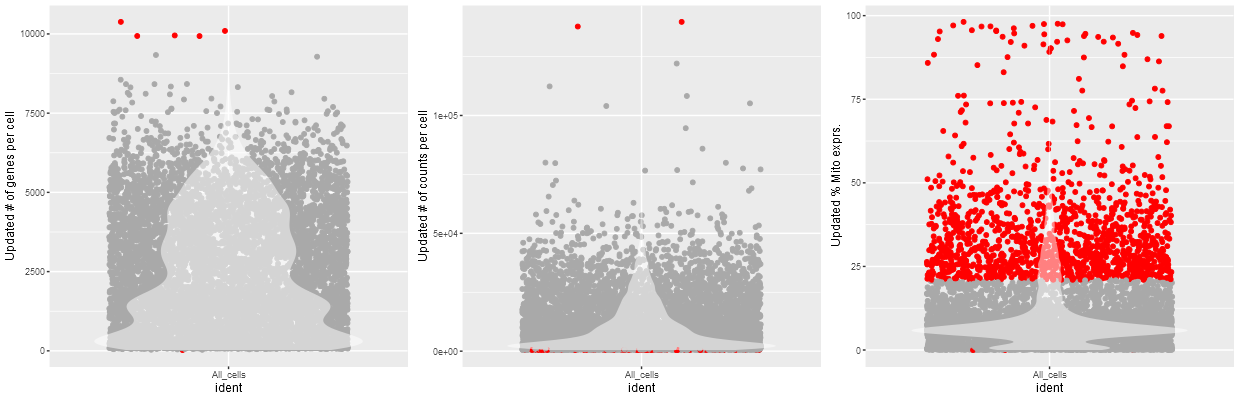
Example Violin plot from QC analysis

Initial Quality control metrics: Three violin plots showing the number of genes per cell, number of UMIs/Counts per cell and % of Mitochondrail expression relative to total expression is produced when performing quality control metrics is chosen
The filtering threshold for each of the QC metric can be set for each of these QC values using a slider bar on the left column. Select the lower and the upper threshold for each of the QC parameters.
Then click on the Update QC graph.
This will show you an updated graph as below.
 ::::rmdcomment The number of cells removed from the sample for further analysis is shown below the graph. This can be used to evaluate the stringency of the quality control approach. ::::
It is worth remembering the following QC recommendations from Luecken and Theis
Perform QC by finding outlier peaks in the number of genes, the count depth and the fraction of mitochondrial reads. Consider these covariates jointly instead of separately.
Be as permissive of QC thresholding as possible, and revisit QC if downstream clustering cannot be interpreted.
If the distribution of QC covariates differ between samples, QC thresholds should be determined separately for each sample to account for sample quality differences as in Plasschaert et al (2018).
You can resume processing the Seurat object to perform quality control to remove more cells. You will need to restart from the raw data to include cells that were removed.
Click on the Filter cells and perform PCA to proceed to normalization, scaling and principal component analysis of highly variable genes. You can select to regress out cell cycle score as an optional step as described in the next section.
The number of genes expressed per cell can vary due to a lot of factors including the difference in transcription status of different cells as well as technical issues such as poor capture and sequencing. A more inclusive approach is recommended while filtering cells based on gene expression. If dead/apoptotic cells are to be removed, filtering cells with very low levels of gene expression might be useful.