11 Normalization, Finding variable genes, Scaling data, and Principal component analysis
Once the Filter cells and perform PCA is pressed, the data is filtered to retain cells that meet the thresholds set in quality control. The rest of the cells are normalized (default normalization method in Seurat), and 2000 genes with the highest variability found. The normalized expression data for these genes are then scaled (using default parameters in Seurat 4.0) and principal component analysis (PCA) is performed on these highly variable genes to identify 50 principal components with using these genes.
In Natian, the PCA data is used to create an Elbow plot as shown in the example below.
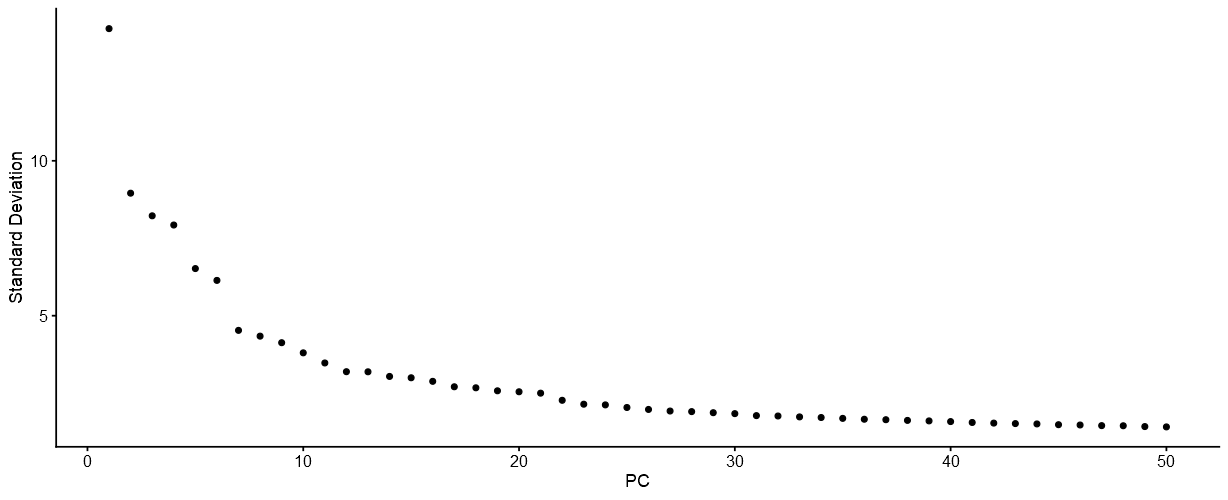
Elbow plot of dimensions vs standard deviation
The elbow plot can be used to determine the number of dimensions to use to perform dimensionality reduction.
In the same step, Natian also identifies nearest neighbors using the FindNeighbors function with a default of top 30 dimensions. Then, a series of clustering steps are undertaken using FindClusters function using the Louvain algorithm by changing the resolution parameter. This series with resolution ranging from 0.1 to 0.9 is then used to construct a Clustree diagram.
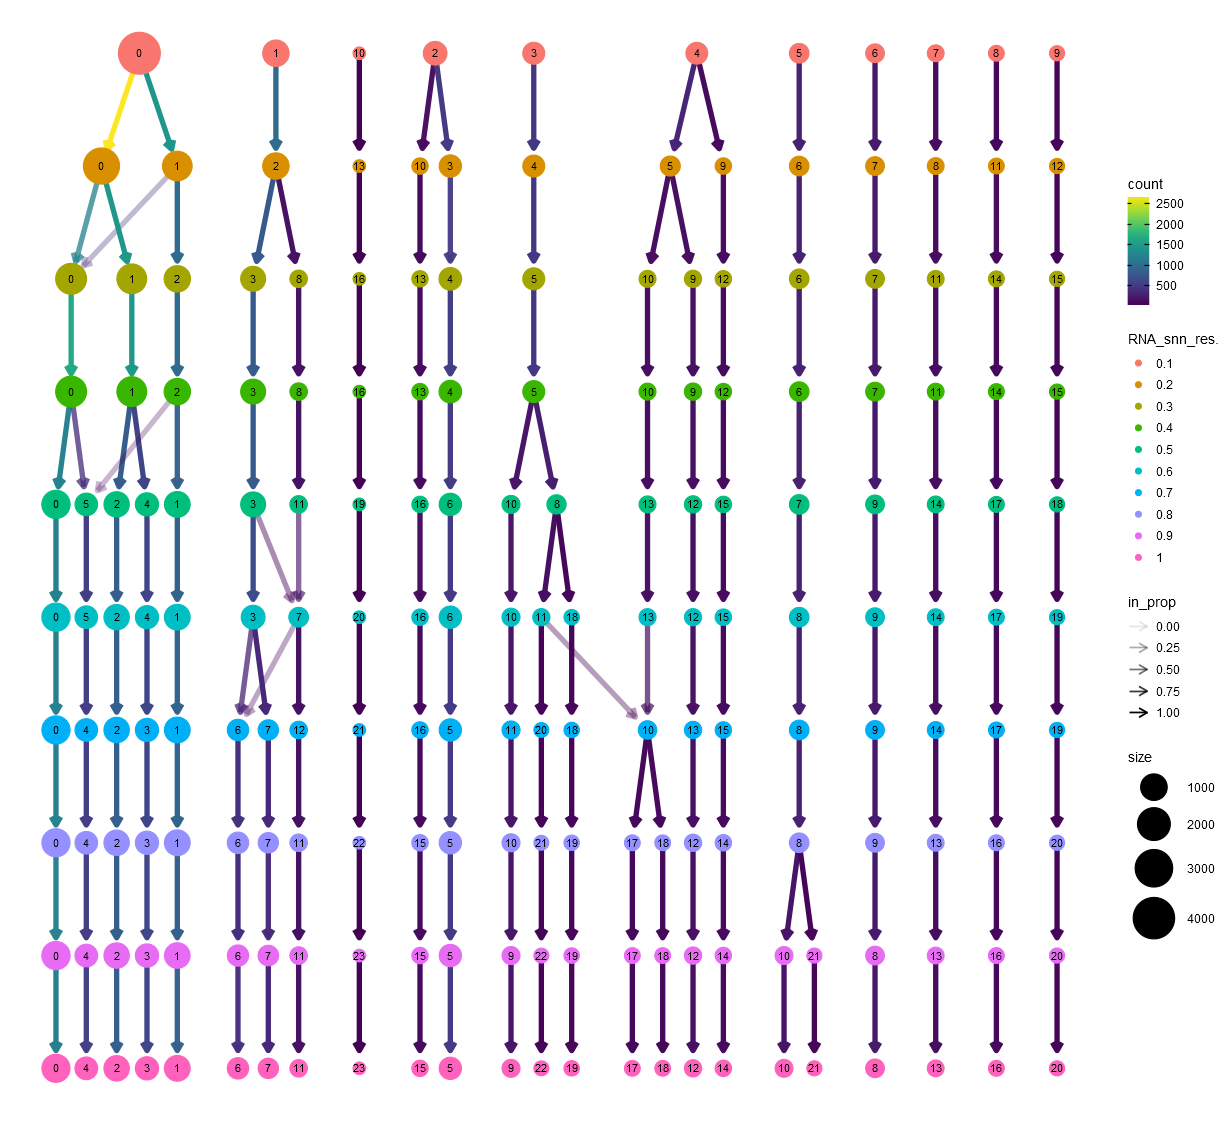
Clustree diagram showing changes to cluster size with increasing resolution
In this diagram, the result of unsupervised clustering using the 30 top dimensions using a number of resolution parameters are shown. Note that the size of the bubbles denotes the size of the clusters in terms of number of cells. The colors of the bubbles correspond to the resolution parameter. The numbers inside the bubbles indicate the relative rank of the cluster (in term of number of cells) for each resolution parameter. The largest cluster for each resolution parameter gets the rank 0 and the rank numbers increase with decreasing size. The arrows indicate how cells are reallocated between new clusters with change in resolution parameter.
It is useful to have a rough idea of the number of clusters (or cell types) that are expected from the sample. You can also use iterative attempts to cluster cells, try and identify cluster markers and if unable to perform analysis, repeat clustering. Natian allows you to repeat just clustering and dimensionality reduction as well as the whole process with different quality control metrics!
You can select the number of dimensions that need to be used and the clustering resolution parameter using the numerical input panels on the left. Once you have selected the number of dimensions and resolution parameter, you can click on the Use PCs and perform
dimensionality reduction
The elbow plot can be considered as a cost-benefit graph. The benefit is the amount of variation captured by addition of individual dimensions (or principal components) or the difference in the standard deviation between two points with increasing number of dimensions. Typically, a noticeable inflection point is detected in the graph, and the number of dimensions corresponding to that inflection point can be considered optimum for dimensionality reduction. This is a heuristic approach to determine the optimal number of dimensions. More detailed analysis using
jackstraworheatmap-based analyses of individual dimensions can be performed. These functions have been omitted in Natian speed-up the processing steps.